
The following information is obtained from the Los Angeles County Health Website located at http://publichealth.lacounty.gov/media/Coronavirus/locations.htm . We took the liberty to convert the data from the LA County Health website into chart based graphs using PowerBI, PNG images, and PDFs.
The information below is updated Weekly until further notice.
Power BI Interactive Charts
The charts below are broken up into the following pages
- Page1: Data Matrix of cases in LA County excluding Pasadena and Long Beach
- Page 2: Chart of all the cases in the LA County Area including the Unincorporated cities.
- Page 3: Number of Total cases vs Death (LA County, Pasadena and Long Beach)
- Page 4: Broken down of the Age Group (Excluding Long Beach and Pasadena)
- Page 5: Gender breakdown (Excluding Long Beach and Pasadena)
- Page 6: Hospitalized (Excluding Long Beach and Pasadena)
- Page 7: Number of Cases vs Population
- Page 8: Race/Ethnicity (Excluding Long Beach and Pasadena)
- Page 9: Death by Race/Ethnicity (Excluding Long Beach and Pasadena)
- Page 10: Number of Death by Location (Excluding Long Beach and Pasadena)
Mobile Version:
![]() If the PowerBI charts below do not fit in your mobile devices,
If the PowerBI charts below do not fit in your mobile devices,
Please click on the Mobile Version Link here.
Usage Tips: Navigate to next page by clicking on (1-9) of 9. Scroll left and Right to get more data. Mouse over bar charts to get more details. Click on the chart to get exact information. Right mouse click on the chart and select “Table info” to get the table matrix of the stats. Click on the Title to sort.
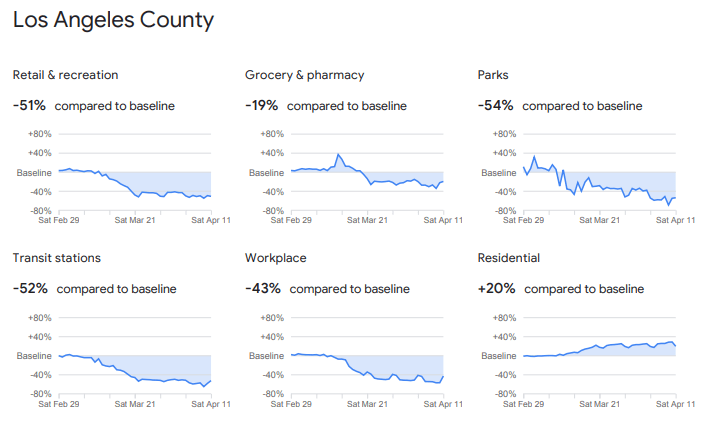
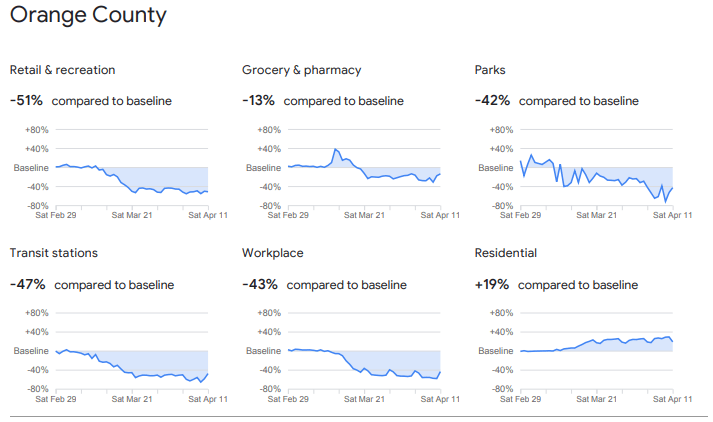
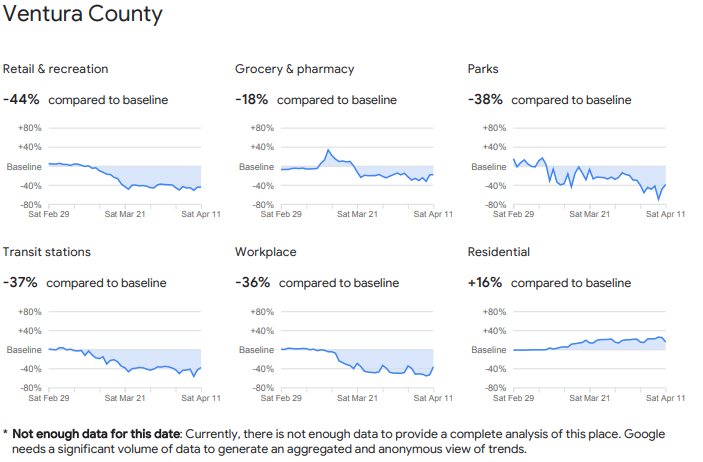
Google COVID-19 Community Mobility Reports
Google has joined the community into combating COVID-19 by providing “The reports chart movement trends over time by geography, across different categories of places such as retail and recreation, groceries and pharmacies, parks, transit stations, workplaces, and residential.”
- Visit Community Mobility Reports for more information
- Download the California Mobility Reports for more up to date information.
Below are some snippets of the reports from the pdf of California Mobility Reports based on the data from February 29 until April 11, 2020.
Non-interactive Charts
Charts in PNG, PDF and HTML format are available below
![]()