Manipulation of gold nanoparticles in liquid environments using scanning force microscopy
R. Resch*, D. Lewis, S. Meltzer, N. Montoya, B.E. Koel, A. Madhukar, A.A.G. Requicha, P. Will
Laboratory for Molecular Robotics,
University of Southern California.
* Corresponding author.
Department of Chemistry,
University of Southern California.
920 W. 37th Street, University Park, Los Angeles, CA 90089-0482, U.S.A.
Fax: +1-213-740-3972
Tel: +1-213-740-4507
E-mail: rresch@lipari.usc.edu
Abstract
Precise and controlled manipulation of individual gold nanoparticles (deposited on a Si/SiO2 surface) in liquid environments using the tip of a scanning force microscope is reported for the first time. Experiments were performed in deionized water and in ethanol as a prototype for an organic solvent. Analysis of the amplitude signal of the cantilever before and during manipulation reveals that the particles are pushed across the surface, similar to the manipulation of nanoparticles in air.
Keywords: Scanning force microscopy, SFM, MAC mode atomic force microscopy, AFM, nanomanipulation, nanoparticle, liquid.
Introduction
Nanoparticle patterns have a variety of potential applications, from digital data storage to single-electron electronics and nanoelectromechanical systems (NEMS) [1]. Precise positioning of individual nanoparticles is essential to assemble complex two- and three-dimensional structures. Although regular, symmetric patterns of nanoparticles can be constructed by self-assembly [2-4], many of the possible applications require asymmetric shapes. One promising approach for the construction of such nanostructures or nanodevices is the assembly from molecular-sized components. The Scanning Force Microscope (SFM) can be used as a manipulation tool to move nanoparticles (as the smallest building blocks) and to build nanostructures without the restrictions imposed by the physics of self-assembly [5-10]. By connecting individual nanoparticles, it is possible to construct relatively rigid structures or “primitives” of arbitrary (planar) shape [11]. These, in turn, may serve as components for building complex NEMS.
Nanomanipulation in biochemical and medical areas, however, will require that most experiments be performed in a liquid environment. Atomic force microscopy has already proven its imaging capabilities in liquid environments [12-14]. But in nanomanipulation only dynamic mode SFM (with an oscillating cantilever) will likely satisfy the need to minimize the influence of the tip on the sample. Furthermore, lateral shear forces are mostly excluded, allowing the imaging and controlled manipulation of even weakly bonded structures on surfaces. In this report we describe for the first time the manipulation of randomly distributed, individual nanoparticles with diameters of 20 to 30 nm in liquid environments.
Experimental
The samples were prepared by depositing colloidal gold particles (EM.GC15; Ted Pella Inc.) with diameters of 15 nm and 30 nm from aqueous solutions on the native SiO2 surface of a Si substrate. Prior to deposition of the nanoparticles the SiO2 surface had been coated with a film of polylysine. A droplet of nanoparticle solution was placed on the substrate for 5 minutes. Subsequently, the sample was rinsed with deionized water, dried with nitrogen, and heated in an oven for 15 min at 120°C. Imaging and pushing experiments were carried out with a Pico SPM from Molecular Imaging operated in the MAC (Magnetic AC) mode controlled by an Autoprobe CP AFM (Park Scientific Instruments) controller. In MAC mode the cantilever oscillates vertically contacting the surface once per oscillation cycle. The reduction in oscillation amplitude when contacting the surface is used to identify and measure surface features. When performing measurements in liquids the oscillation amplitude is usually around 5 nm (significantly smaller than for measurements in air due to the damping by the surrounding liquid). In these experiments commercially available cantilevers with a spring constant of 0.5 Nm-1, a typical tip radius of 10 – 20 nm and a tip half angle of 35 degrees were used and driven at a frequency of ~20-30 kHz. The scan speed was 1.0 Hz at 256 lines per scan. In general, we haven’t noticed a speed dependence of the nanomanipulation (accuracy, reliability) in air or in liquids as long as the scan speed was in the range between 0.1 Hz to 3 Hz. However, a fast scan speed can result in a large overshooting of the amplitude when the feedback is switched on again.
Manipulation of the gold nanoparticles was performed by utilizing the Probe Control Software (PCS) developed in our group [6-10] and built upon the application programming interface (API) provided by PSI. This software allows the user to take single line scans by setting an “arrow” in a previously recorded dynamic mode image. The arrow determines the direction and length of the scan line and can be moved by the operator in the x- and y-direction until the displayed topography indicates that its path is centered over the particle. In order to compensate for relative position drifts, a tracking tool based on the differential height between the particle and the surface can be activated to keep the arrow aligned at the center of the particle. Two bars are positioned along the scan line within which alternative operating conditions of the AFM, and therefore the “start” and “end” points of the manipulation, can be selected. The feedback was turned off just before the tip was scanned across the particle and switched back on after reaching the desired lateral position. In case the particles and structures one wants to manipulate are strongly attached to the underlying surface, a contact mode set-up is recommended. One can select either a feedback-off protocol with or without additional direct movement of the scanner, or a feedback-on protocol with indirect movement of the scanner by changing the deflection of the cantilever and therefore varying the force. However, in these experiments the DFM setup was chosen because the nanoparticles cannot be imaged accurately in contact mode SFM and are moved during imaging due to the presence of lateral shear forces.
Results
Fig. 1 displays a sequence of MAC mode SFM images taken in deionized water before and after pushing. The scan area is 700 nm x 700 nm and the height scale is 15 nm from black to white. Among others, four particles with diameters of ~27 nm and marked by the numbers 1 to 4, and one particle with a diameter of 15 nm marked as number 5 can be observed. Fig. 1b records the successful pushing of particles 3 and 5 with respect to Fig. 1a. Subsequently, all four particles 1 – 4 were manipulated to form a line of 27 nm particles as displayed in Fig. 1c.
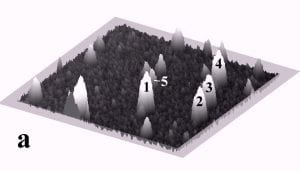
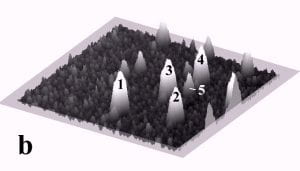
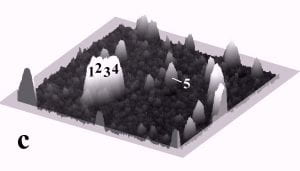
Fig. 1 – Sequence of 700 nm by 700 nm SFM images showing the manipulation of individual gold nanoparticles (marked as 1 – 5) in deionized water. (a) SFM image before manipulation, (b) and (c) SFM images recording the construction of the four particle line (1-4). The height scale is 15 nm from black to white.
The underlying mechanics of the manipulation process can be analyzed by recording the amplitude signal during manipulation and the new position of the nanoparticle after manipulation. This is displayed in Fig. 2. Basically, the manipulation process with MAC mode SFM in liquids is similar to manipulation of nanoparticles with oscillating cantilever techniques in air (in cases where the sum of the setpoint amplitude and separation between tip and sample is smaller than the height of the particle [18]). The tip pushed the nanoparticle after the amplitude decreased close to zero and the cantilever bent to achieve a certain loading force. Fig. 2a shows the line-scan across a 27 nm particle obtained in MAC mode with the feedback on prior to pushing. The two vertical bars represent the window in which the feedback was subsequently turned off in order to push the particle. Fig. 2b records the scan line during the pushing operation (feedback-off between the bars), while the subsequent line scan (feedback-on) after manipulation is shown in Fig. 2c. The particle has moved to its new position, however, a small part of it remained inside the “feedback-off” window. This demonstrates that the tip pushed the particle after climbing up the particle until a certain deflection of the cantilever occurred.
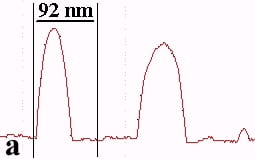
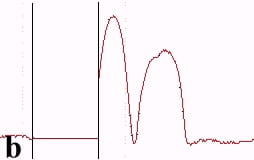
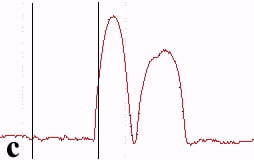
Fig. 2 – Line scans recorded (a) before manipulation (feedback on between the bars), (b) during pushing (feedback off between the bars), and (c) after manipulation (feedback on) of a 27 nm nanoparticle.
Fig. 3a shows the change in the amplitude of the cantilever during manipulation. The amplitude decreases to a value close to zero when getting into contact with the particle (marked by the arrow) and remains close to zero during manipulation. This can be confirmed by switching the amplitude to zero (marked by the arrow) while performing a line scan as shown in Fig 3b. There is no difference between the setpoint amplitude and zero amplitude within the range of uncertainty due to the noise level of the oscillation. Both scales are in arbitrary units. In principle the x-scale represents time, but because the particle was pushed around 90 nm, the length of the decreased amplitude signal is equal to 90 nm, too.
When a smaller free amplitude of the cantilever was chosen (resulting in a setpoint amplitude close to zero (not shown here)), pushing occurred without a noticeable change in the amplitude signal during manipulation. However, the resulting scan line after pushing shows that also a very small part of the particle remains inside the feedback-off window. Because the amplitude was smaller in this case, the tip-sample separation was also smaller and the particle was pushed close to the entire distance set by the bars.
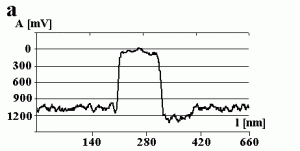
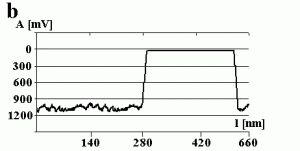
Fig.3 – The amplitude A of the cantilever recorded (a) during a successful pushing experiment and (b) when switching the free amplitude to zero.
Fig. 4a and 4b display a sequence of MAC mode SFM images obtained in ethanol to illustrate nanoparticle manipulation in an organic solvent. Nanomanipulation experiments can be reliably performed in organic solvents with our setup, despite the occurrence of instabilities due to the generally higher vapor pressure of organic solvents compared to water. Furthermore, after a certain time vaporized solvent has to be replaced leading to instabilities due to temperature gradients in the solvent. Fig. 4b provides a record of the successful manipulation of a particle with a diameter of 22 nm (marked as 3) and two particles with diameters of 27 nm (marked as 1 and 2) from their original positions as shown in Fig. 4a. The scan area is 700 nm x 700 nm and the height scale is 20 nm from black to white.
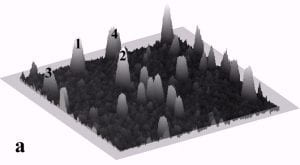
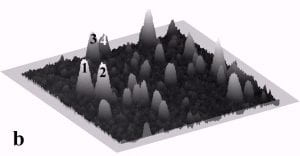
Fig. 4 – Sequence of 700 nm by 700 nm SFM images showing the manipulation in ethanol of individual gold particles marked as 1,2, and 3. (a) SFM image of the surface area before manipulation, (b) the same area after successful pushing. The height scale is 20 nm from black to white.
Conclusion
Manipulation of nanoparticles utilizing the tip of a scanning force microscope has been demonstrated in liquids for the first time. The nanoparticles can be precisely translated by mechanically pushing and multi-particle nanoscale 2-D patterns can be assembled from single gold nanoparticles with the sample immersed in solutions. This greatly extends the previously reported capabilities for SFM manipulation in two ways. The ability to perform mechanical nanomanipulation in liquids offers the opportunity to perform manipulation experiments in biochemistry and medicine, which often require a liquid environment. Furthermore, nanomanipulation in a liquid environment will enable a better control of the tip/object and object/substrate forces, which ultimately determine the nature and success of manipulation operations.
Acknowledgements
This research was supported in part by the Z.A. Kaprielian Technology Innovation Fund and by the NSF under grant EIA-98-71775.
References
[1] A.A.G. Requicha, J. Nanoparticle Research (1999) in press.
[2] R.P. Andres J.D. Bielefeld, J.L. Henderson, D.B. Janes, V.R. Kolagunta, C.P. Kubiak, W.J. Mahoney, R.G. Osifchin, Science 273 (1996) 1690.
[3] K. Vijaya Sarathy, G.U. Kulkarni, C.N.R. Rao, J. Chem. Soc., Chem. Commun. (1997) 537.
[4] P.C. Ohara, J.R. Heath, and W.M. Gelbart, Angew. Chemie Int. Ed. Engl. 36 (1997) 1077.
[5] D.M. Schaefer, R. Reifenberger, A. Patil, R.P. Andres, Appl. Phys. Lett. 66 (1995) 1012.
[6] T. Junno, K. Deppert, L. Montelius, L. Samuelson, Appl. Phys. Lett. 66 (1995) 3627.
[7] C. Baur, B.C. Gazen, B.E. Koel, T.R. Ramachandran, A.A.G. Requicha, L. Zini, J. Vac. Sci. Technol. B15 (1997) 1577.
[8] R. Resch, C. Baur, A. Bugacov, B.C. Gazen, B.E. Koel, A. Madhukar, T.R. Ramachandran , A.A.G. Requicha, P. Will, Appl. Phys. A 67 (1998) 265.
[9] C. Baur, A. Bugacov, B.E. Koel, A. Madhukar, N. Montoya, T.R. Ramachandran, A.A.G. Requicha, R. Resch, P. Will, Nanotechnology 9 (1998) 360.
[10] R. Resch, A. Bugacov, C. Baur, B.E Koel, A. Madhukar, A.A.G. Requicha, P. Will, Langmuir 14 (1998) 6613.
[11] R. Resch, C. Baur, A. Bugacov, B.E. Koel, P.M. Echternach, A. Madhukar, N. Montoya, A.A.G. Requicha, P. Will, J. Phys. Chem. B 103 (1999) 3647.
[12] H. Yamada, S. Akamine, C.F. Quate, Ultramicroscopy 42-44 (1992) 1044.
[13] D.J. Mueller, F.A. Schabert, G. Bueldt, A. Engel, Biophys. J. 68 (1995) 1681.
[14] T. Shibata-Seki, J. Masai, T. Tagawa, T. Sorin, S. Kondo, Thin Solid Films 273 (1996) 297.
[15] C.A.J. Putman, K.O. van der Werf, B.G. de Grooth, N.F. van Hulst, Appl. Phys. Lett. 64 (1994) 2454.
[16] M. Radmacher, M. Fritz, P.K. Hansma, Biophysical J. 69 (1995) 264.
[17] Th. Vallant, H. Brunner, U. Mayer, H. Hoffmann, T. Leitner, R. Resch, G. Friedbacher J. Phys. Chem. B 102 (1998) 7190.
[18] A. Bugacov, R. Resch, C. Baur, N. Montoya, K. Woronowicz, A. Papson, B.E. Koel, A.A.G. Requicha, P. Will, Probe Microscopy (1999) in press.
